Case study
Logistics Ecosystem
A multinational logistics & transportation company had incrementally built a confusing thicket of silo’d enterprise apps over the course of decades of crisis-management software development. This had led to sluggish scheduling and delivery, an inability to respond to unexpected changes in conditions, spiraling costs, employee retention & recruitment issues, and loss of market share.
The entire software ecosystem needed to be redesigned. There were a LOT of dependencies and hidden connections that needed to be understood.

High-Fidelity Prototype
I designed these and the prototypes you’ll see at the end of this case study to guide data & engineering, as they built the new software ecosystem.
Below, you will see the process I followed: from site visits and interviews, to developing task flows, user personas & journey maps, and finally using the accumulated knowledge to start the redesign process.
Goal
Craft Consistent, Functional Software Experiences
Employees must be able to accomplish their daily tasks in a single software system.
Customers need reliable ways to schedule, re-schedule, adjust, cancel, and track shipments.
Management needs more robust insights into where breakdowns are costing money and driving away customers.
Research Methods
Ethnographic research; on-site interviews; remote sessions; competitive analysis; deep dive into relevant analytics.
Insight Validation
Leading discovery workshops with senior management to uncover additional problem areas; translating research insights into top-level task flows, user personas, and journey maps.
Iterative Design
Rapid wireframe brainstorming on paper in design workshops; rapid high-fidelity mockups for further validation with stakeholder groups.
Skills
Strategic Design Ops and Planning, translating data into actionable visuals; project management; rapid high-fidelity prototyping; design workshops
Outputs
User personas, journey maps, task flows, low-fidelity wireframes, high-fidelity prototypes — all designed align business objectives with market opportunities and maximize customer retention.
Research Methods
On-site visits reveal employees having to repeat tasks by cutting and pasting from paper to apps and then back to paper again
The Control+C / Control+V letters were worn off the computer keyboards.
Employees repeatedly spent time searching through multiple tabs in as many as 18 spreadsheets that were open at any time, searching for the data they needed, and then copying that data into yet another app. Errors were inevitable.

Ethnographic observation
My background as a journalist really comes in handy during site visits, as I am able to record high-quality audio and video, and edit together short, concise clips that clearly illustrate user behavior.
As I learned while doing interviews for network news shows like ABC’s PrimeTime, the best moments come when you can make the subects relax, and behave normally. I have found that just being patient, and allowing people to relax, and get over their initial excitement or wariness, slowly starts to bring out authentic behaviors.
These unguarded moments come in handy weeks, or months later, when designers are advocating for changes in function, UI, or workflows.
Stills, video, and audio are essential to building products that address the real problems – rather than the surveys or interviews where users tend to tell you the things they think you want to hear (or that serve their own purposes).
Remote Interviews
Employees were initially wary of another software ecosystem redesign effort, as previous attempts to streamline processes had resulted in the rollout of specialized software to do particular tasks that only added to the number of apps that they were now required to use.
It was very helpful to lead the stakeholders through a step-by-step recounting of all the challenges, tasks and deliverables they were expected to address each day. The process revealed the workarounds that had developed organically, and that would need to be honored with the final software rollout.

Insight Validation
Goal
“Reality Check” for Research; Creating & Delivering Visuals
No research process is perfect, and it is vital to circle back to stakeholders at every level to verify that “the things we think that we think are not unthinkably bad.”
Visual design artifacts like detailed user personas, journey maps, and task flowcharts give clients a quick and intuitive way to start to grasp processes that they often take for granted.
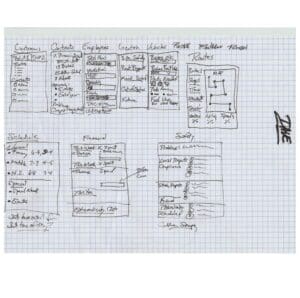
Dependency Maps
In such a complex environment, it is crucial to construct visual aids to ensure everyone (researchers, clients, devs, designers) is aware of all the connections and dependencies. These maps tend to grow during the product development process, as new items are discovered.

Task Flows
Interviews with front-line workers revealed that the broken softwear experience had resulted in the creation of ad-hoc workflows. It was necessary to take these workarounds into account to reduce resistance to the introduction of new workflows.

Building User Personas
While there is often intense pressure to complete personas as quickly as possible, to progress to the design process, understanding the wants, needs, and aversions of users is key to building products that satisfy needs the first time around.

Journey Maps
For both the personas and journey maps, I like to use the UXPressia tool. It has useful prompts that speed up the process, and produces collaborative files that can easily be shared with clients and stakeholders.

Design Workshops
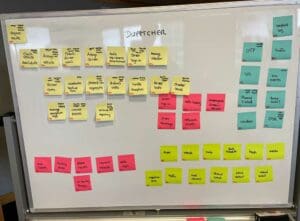
Workshops are a crucial step where “theory comes into contact with the real world.” All the research, insights & understanding is presented to stakeholders, as everyone starts brainstorming & prioritizing solutions.
Whiteboarding, whether done virtually (via apps such as Miro, Mural, or Adobe XD) or in person using sticky notes, helps unify & prioritize design decisions, and needed changes.


Iterative Design
PROCESS
“Design is Intent, Rendered”
This Only Happens in Stages
Traditional waterfall product development methods can result in designers going off to their little “design cave” to toil, curse, scribble, etc., only to emerge weeks/months later with an eye-blastingly amazing creation that wins awards and makes strong design directors weep.
If only it were that easy.
No, modern Agile methodologies call for us to check in regularly; to communicate with everyone else working on these complex problems to make sure that what we design can actually be built.
The following is a snapshot of how I did it:
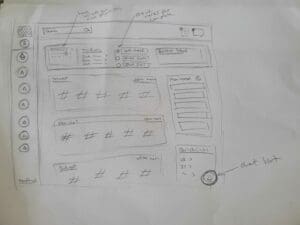
Crazy 8s
I used the “Crazy 8” design brainstorming methodology to rapidly produce visions of the various enterprise data dashboards and control panels that were needed.
Individual wireframe
Progressing from the brainstorming phase, the next step was to narrow down on the indivisual dashboards and software interfaces, to start defining how best to incorporate the insights.
Mapping interactions
As each individual design starts taking shape, I circled back and, referring to the “mind map” I created earlier, I started working out how all the various tasks and user needs connected to each other.
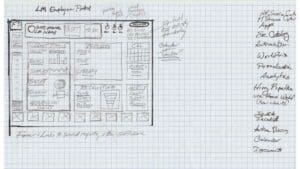
Before and After
Click and drag the slider to see how the initial pen-and-paper sketches translated into the final high-fidelity prototypes.


Results
Goal: Achieved
Redesigned Ecosystem Boosts Productivity, Reduces Errors
Client began roll-out of new interfaces and functionality to staff to enthusiastic approval.
The streamlined functionality helped the regional and individual location managers more easily work through their daily tasks, without having to resort to the use of ad-hoc workflows nor the spreadsheet-to-spreadsheet cutting and pasting.
Employee satisfaction rose, errors decreased, and fewer emergencies resulted because of delays or misrouting.